Screen Time : Data Visual
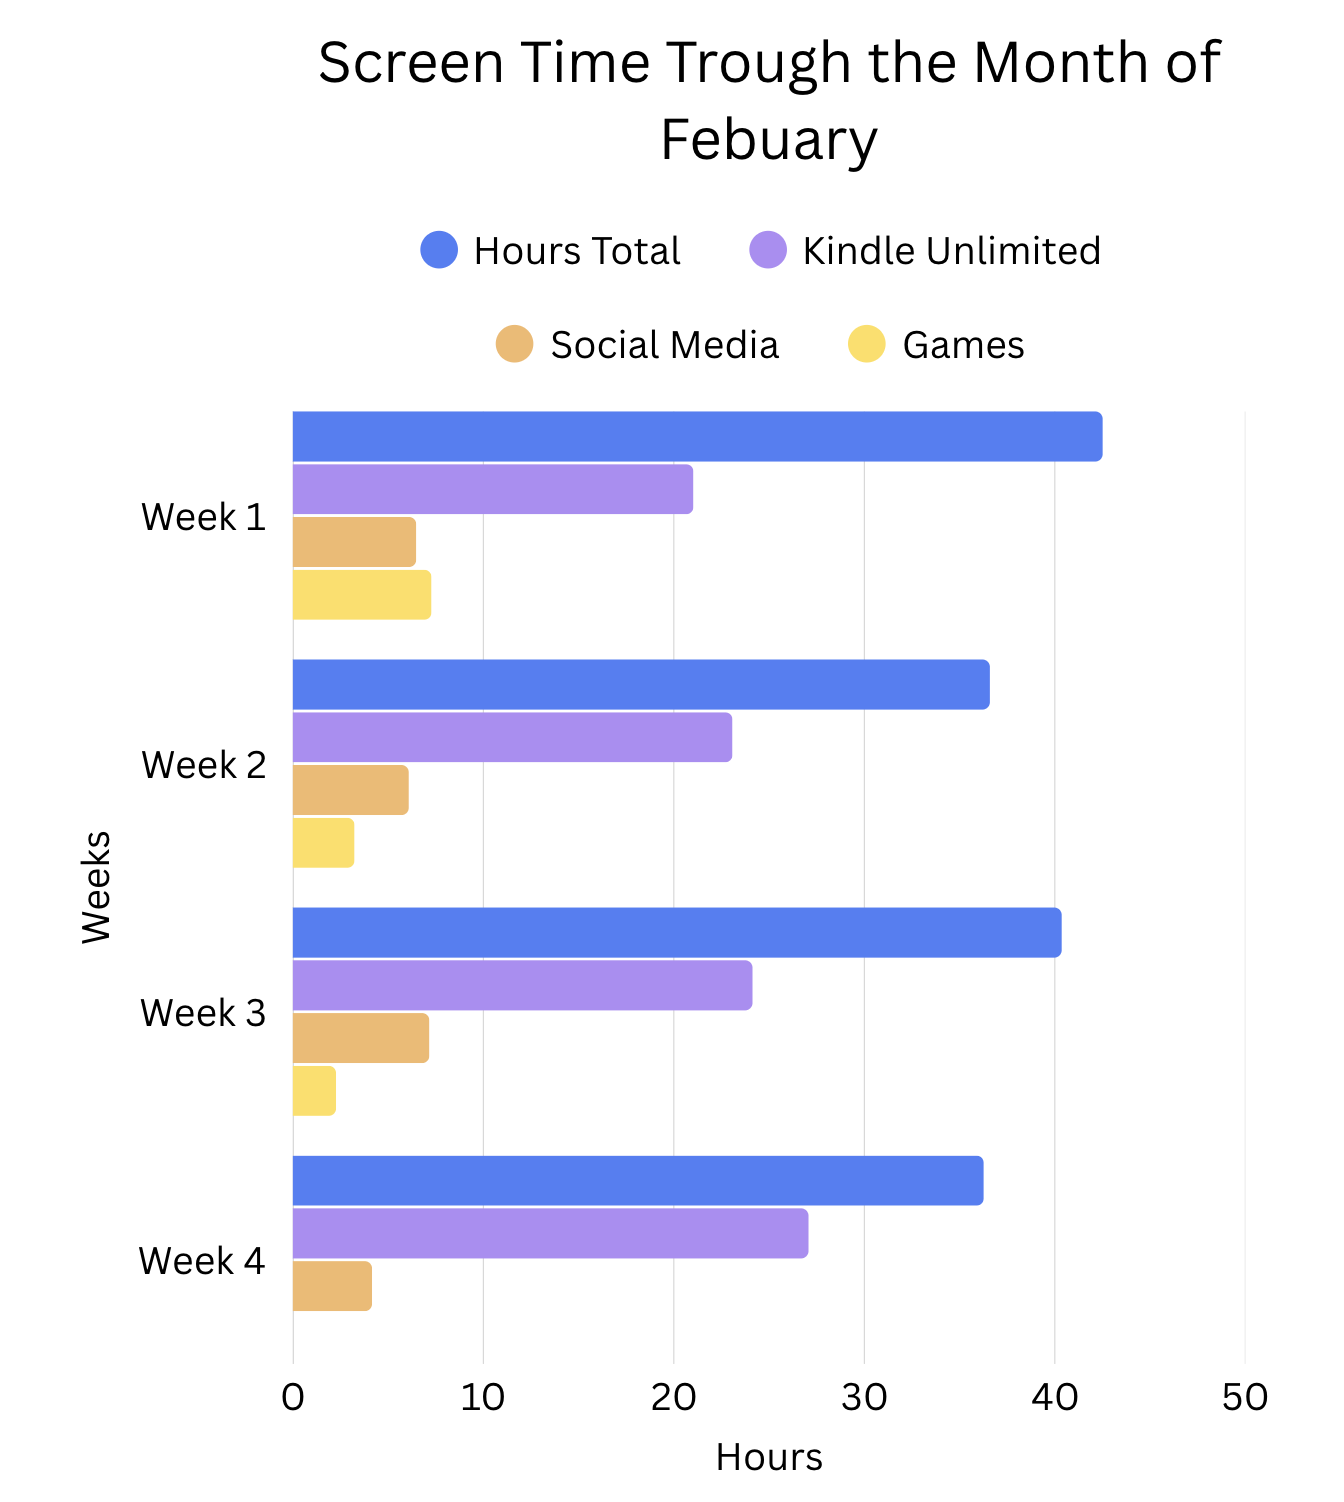
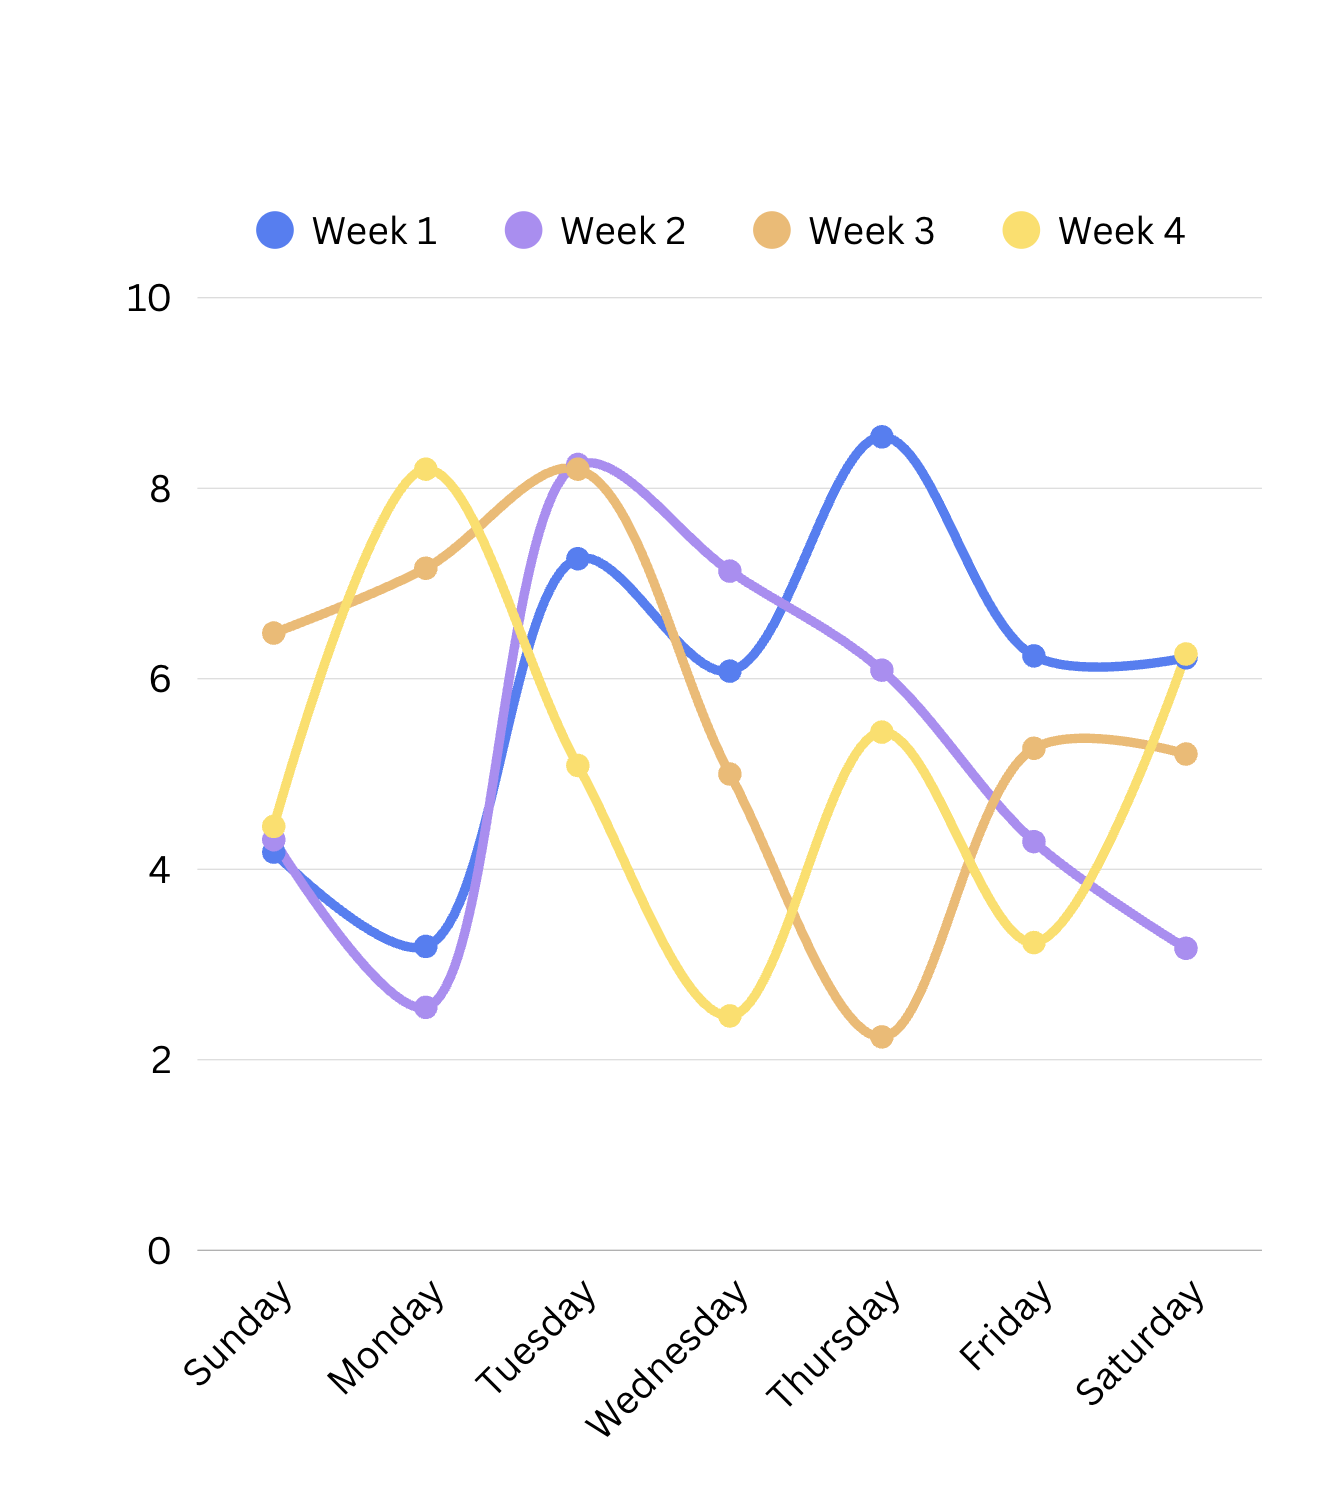
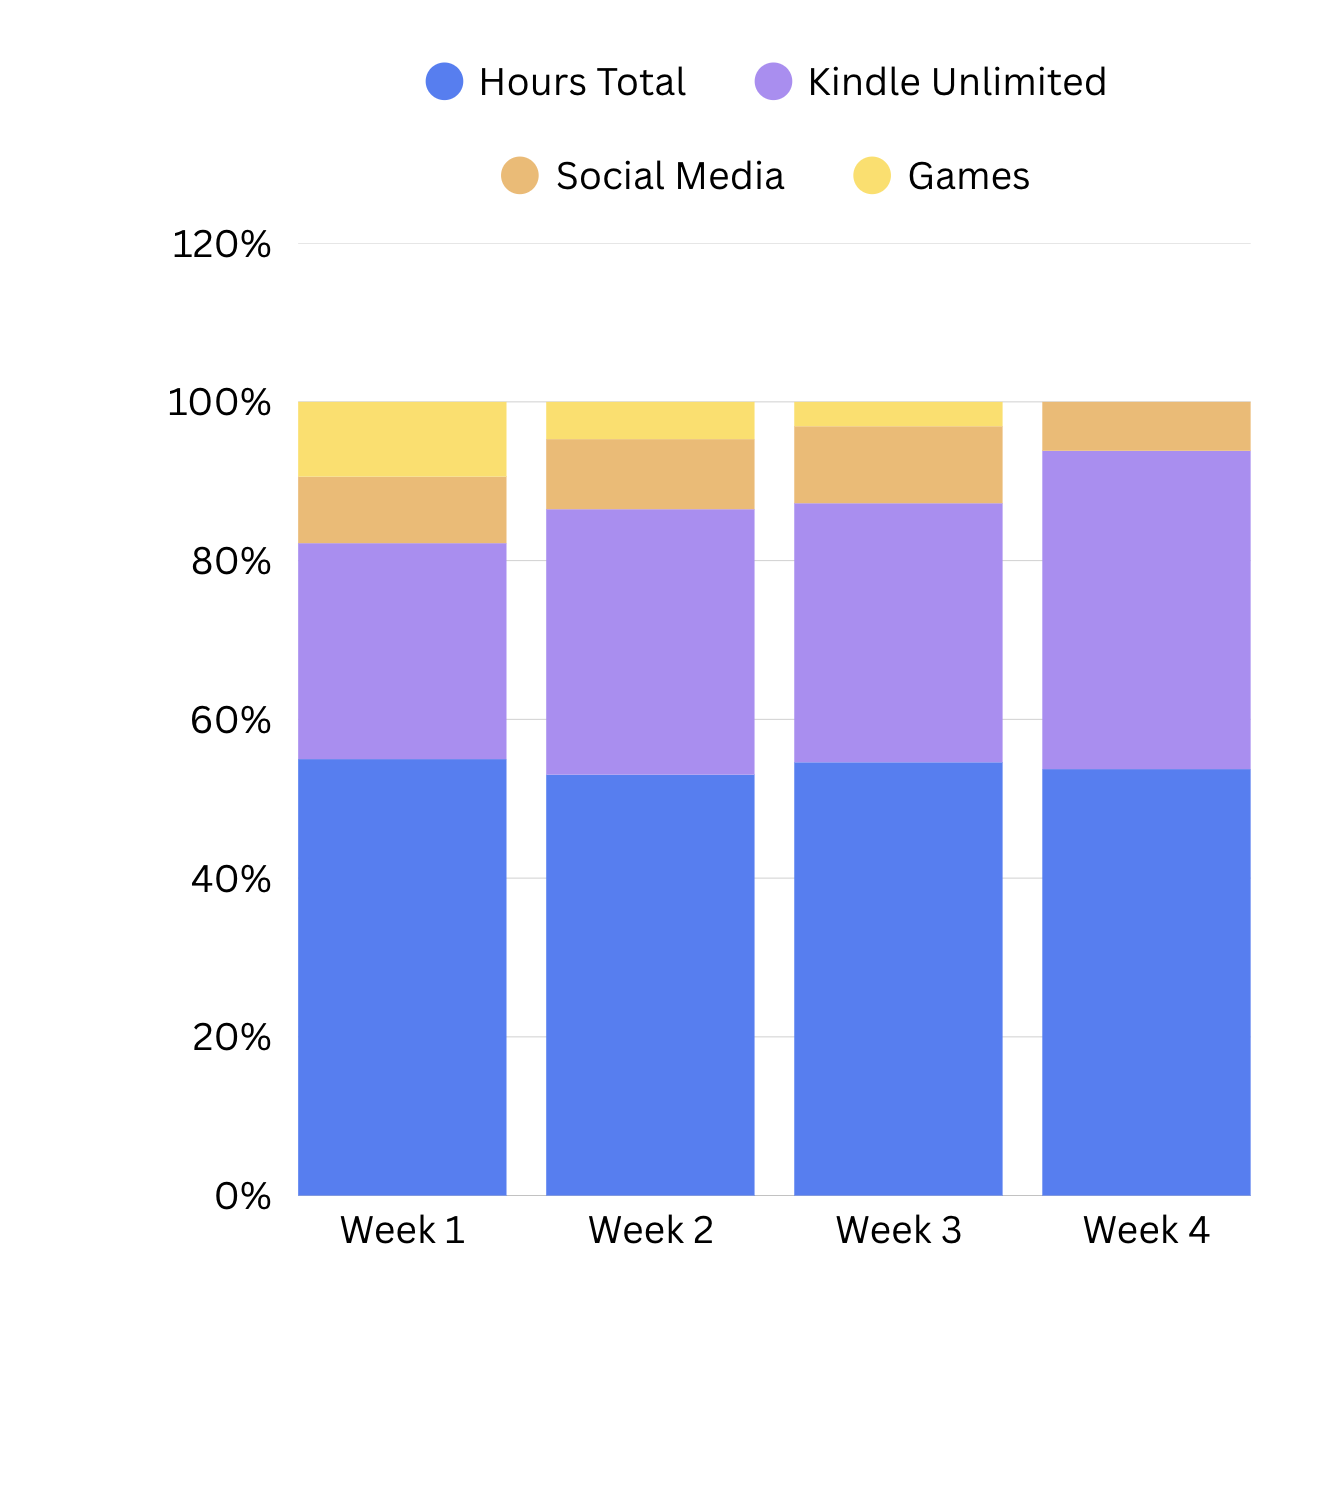
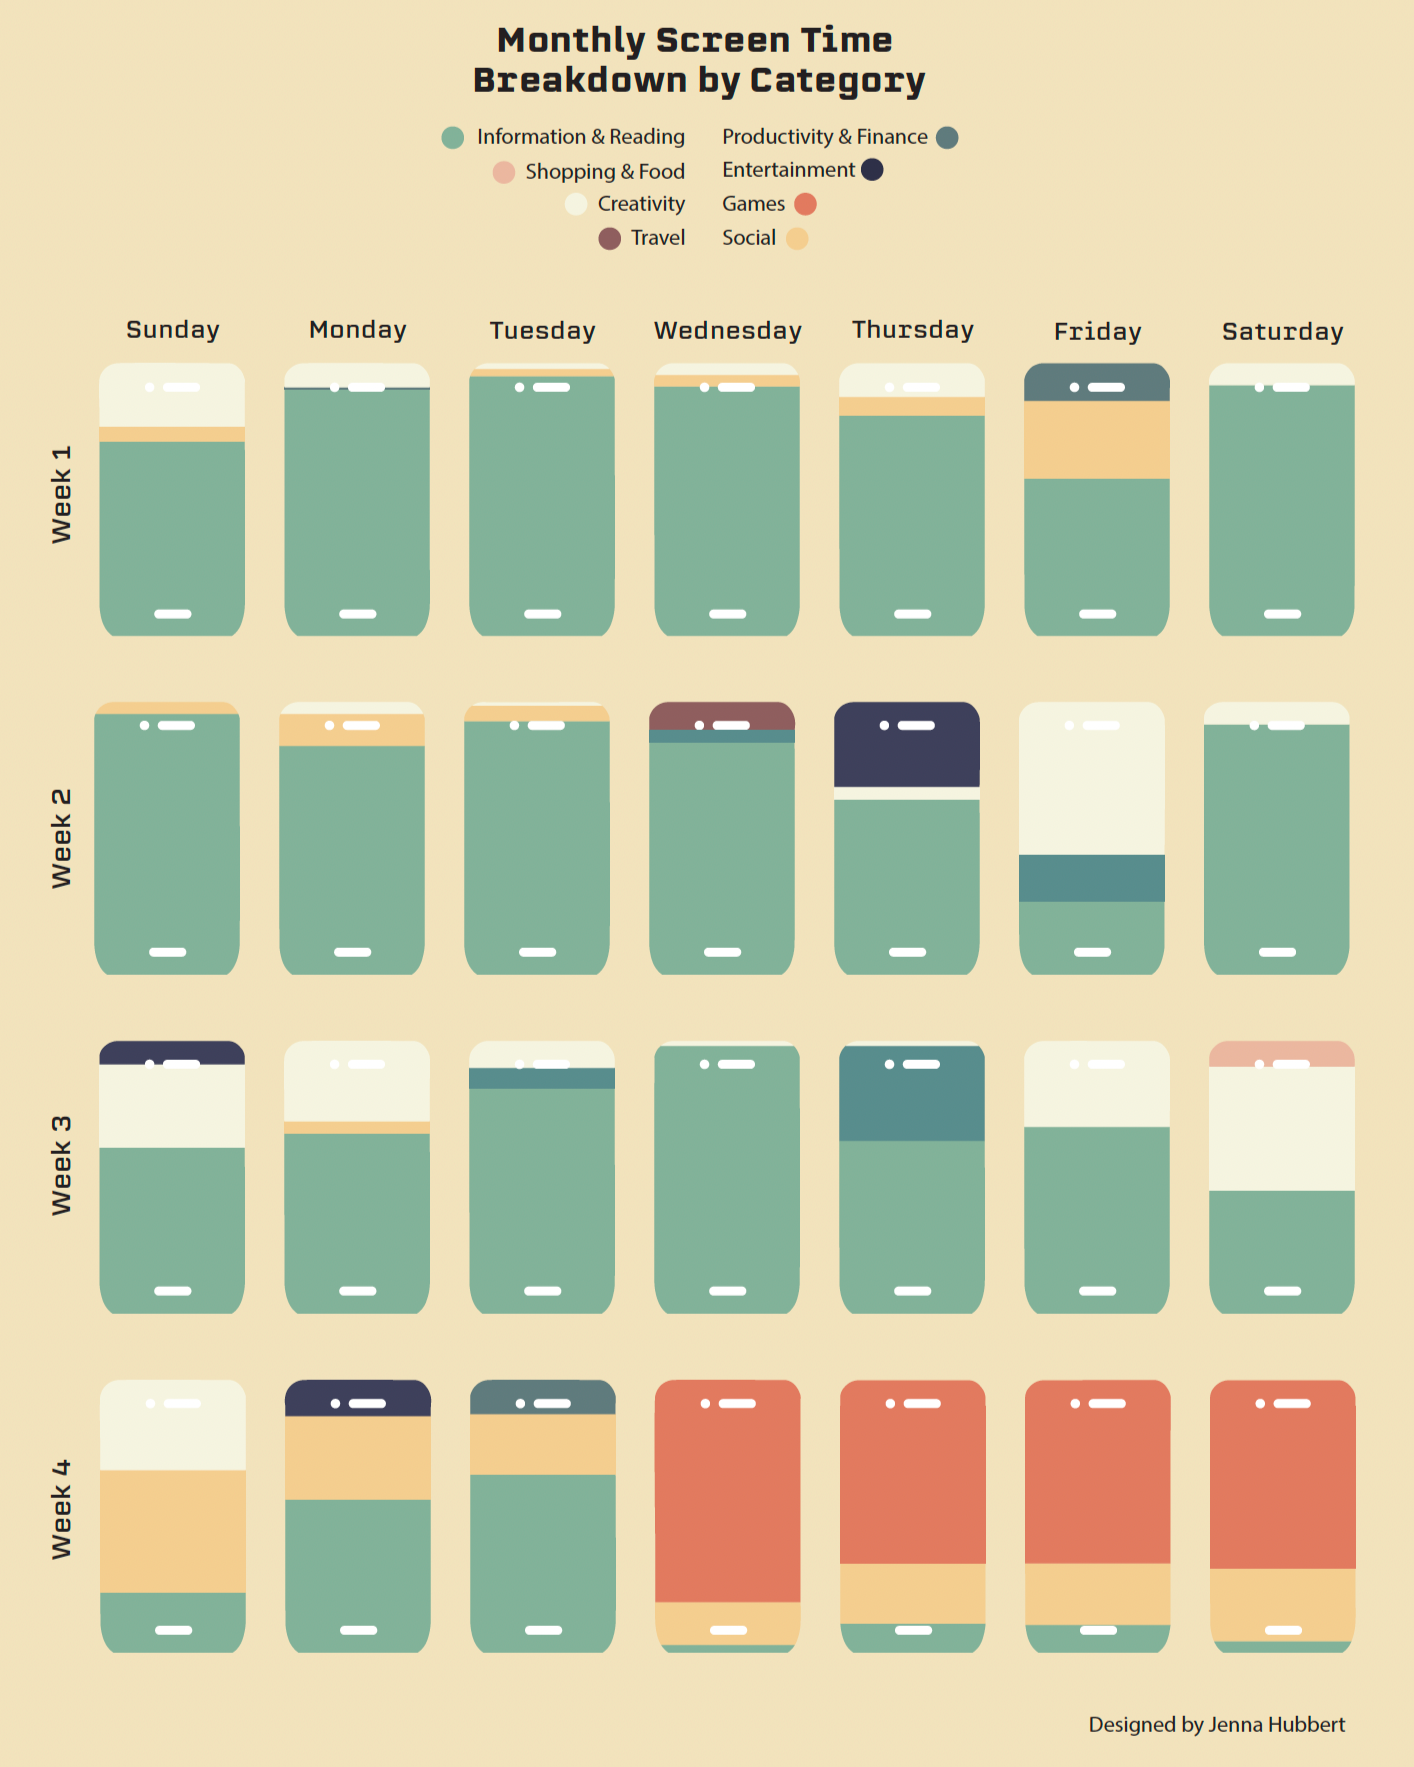
This project tracks my personal screen time over a four-week period. I originally explored a similar idea during my sophomore year, but I wanted to revisit it and improve my approach. I collected daily data and organized it into a spreadsheet to better understand my habits. Using that information, I created a visual that highlights patterns in how I spend time on different apps and activities.
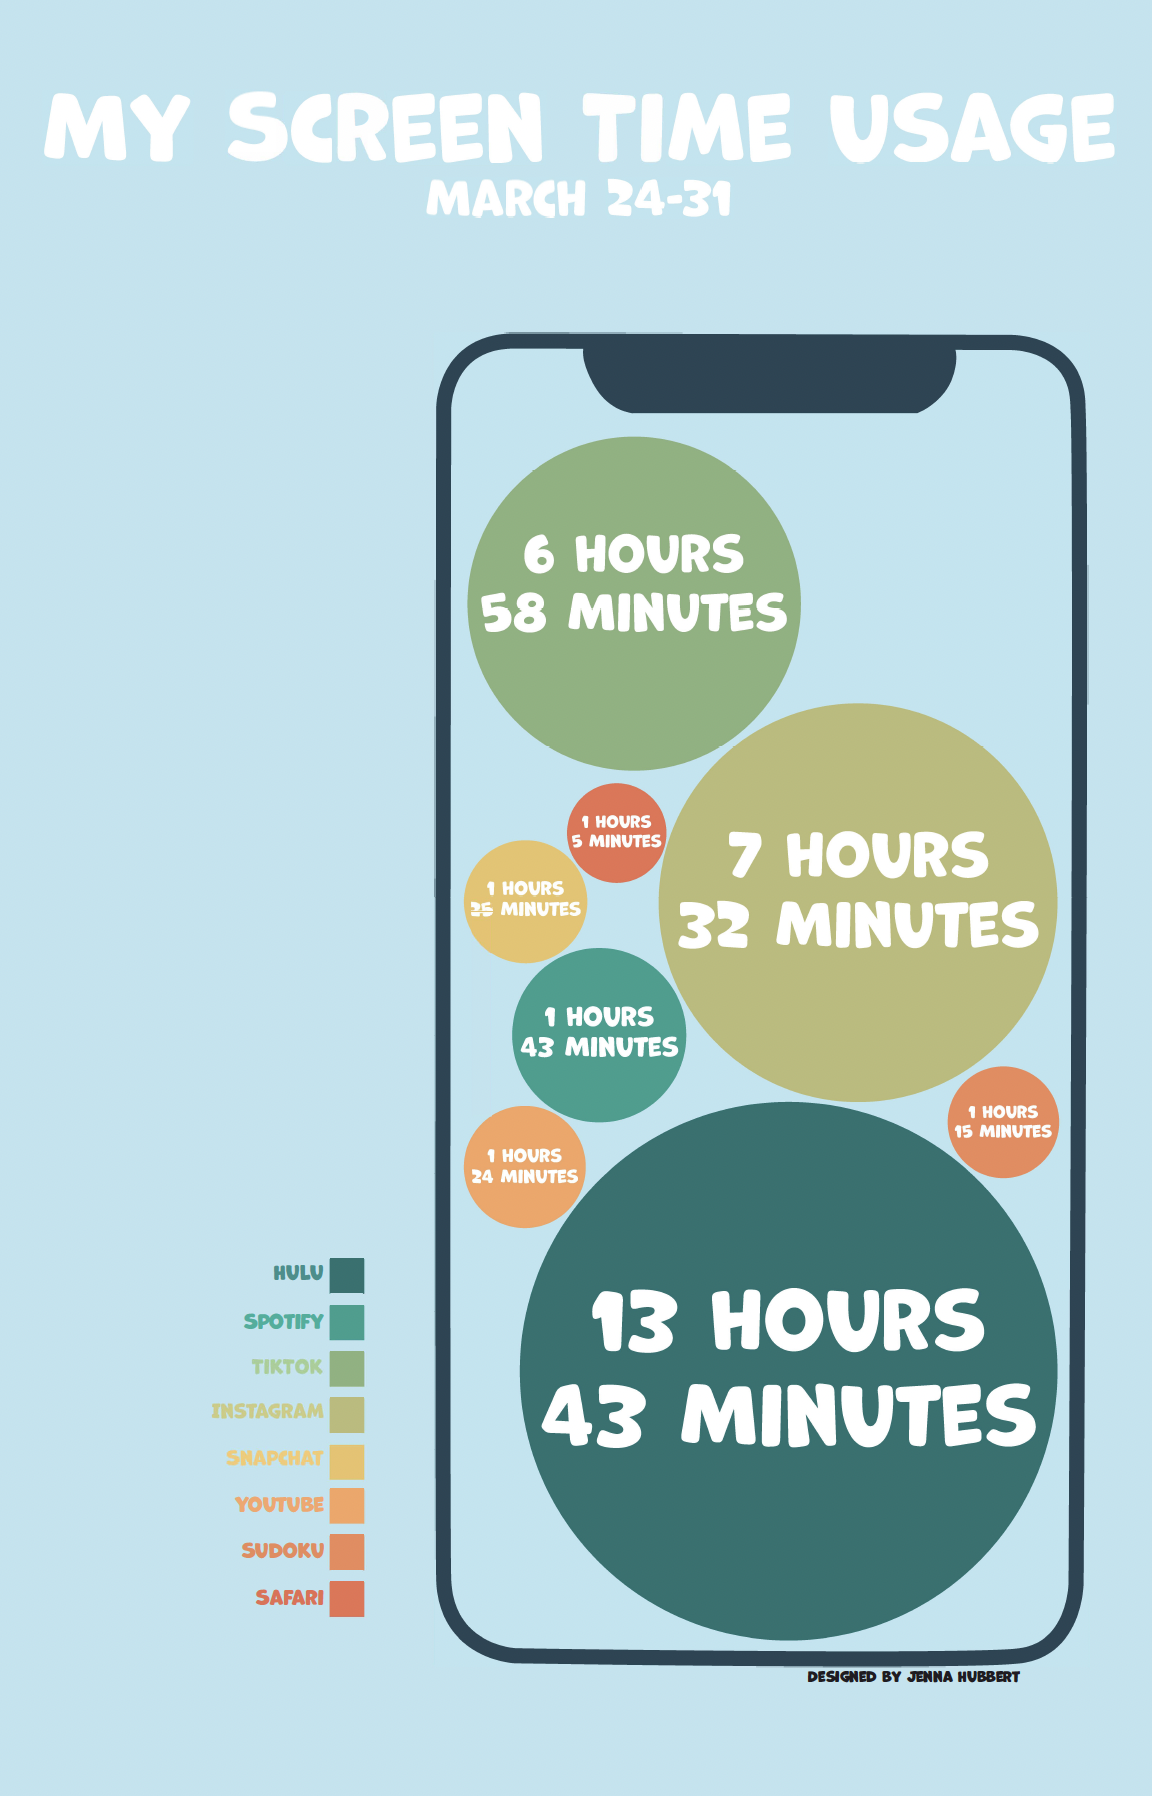
Sophmore year project
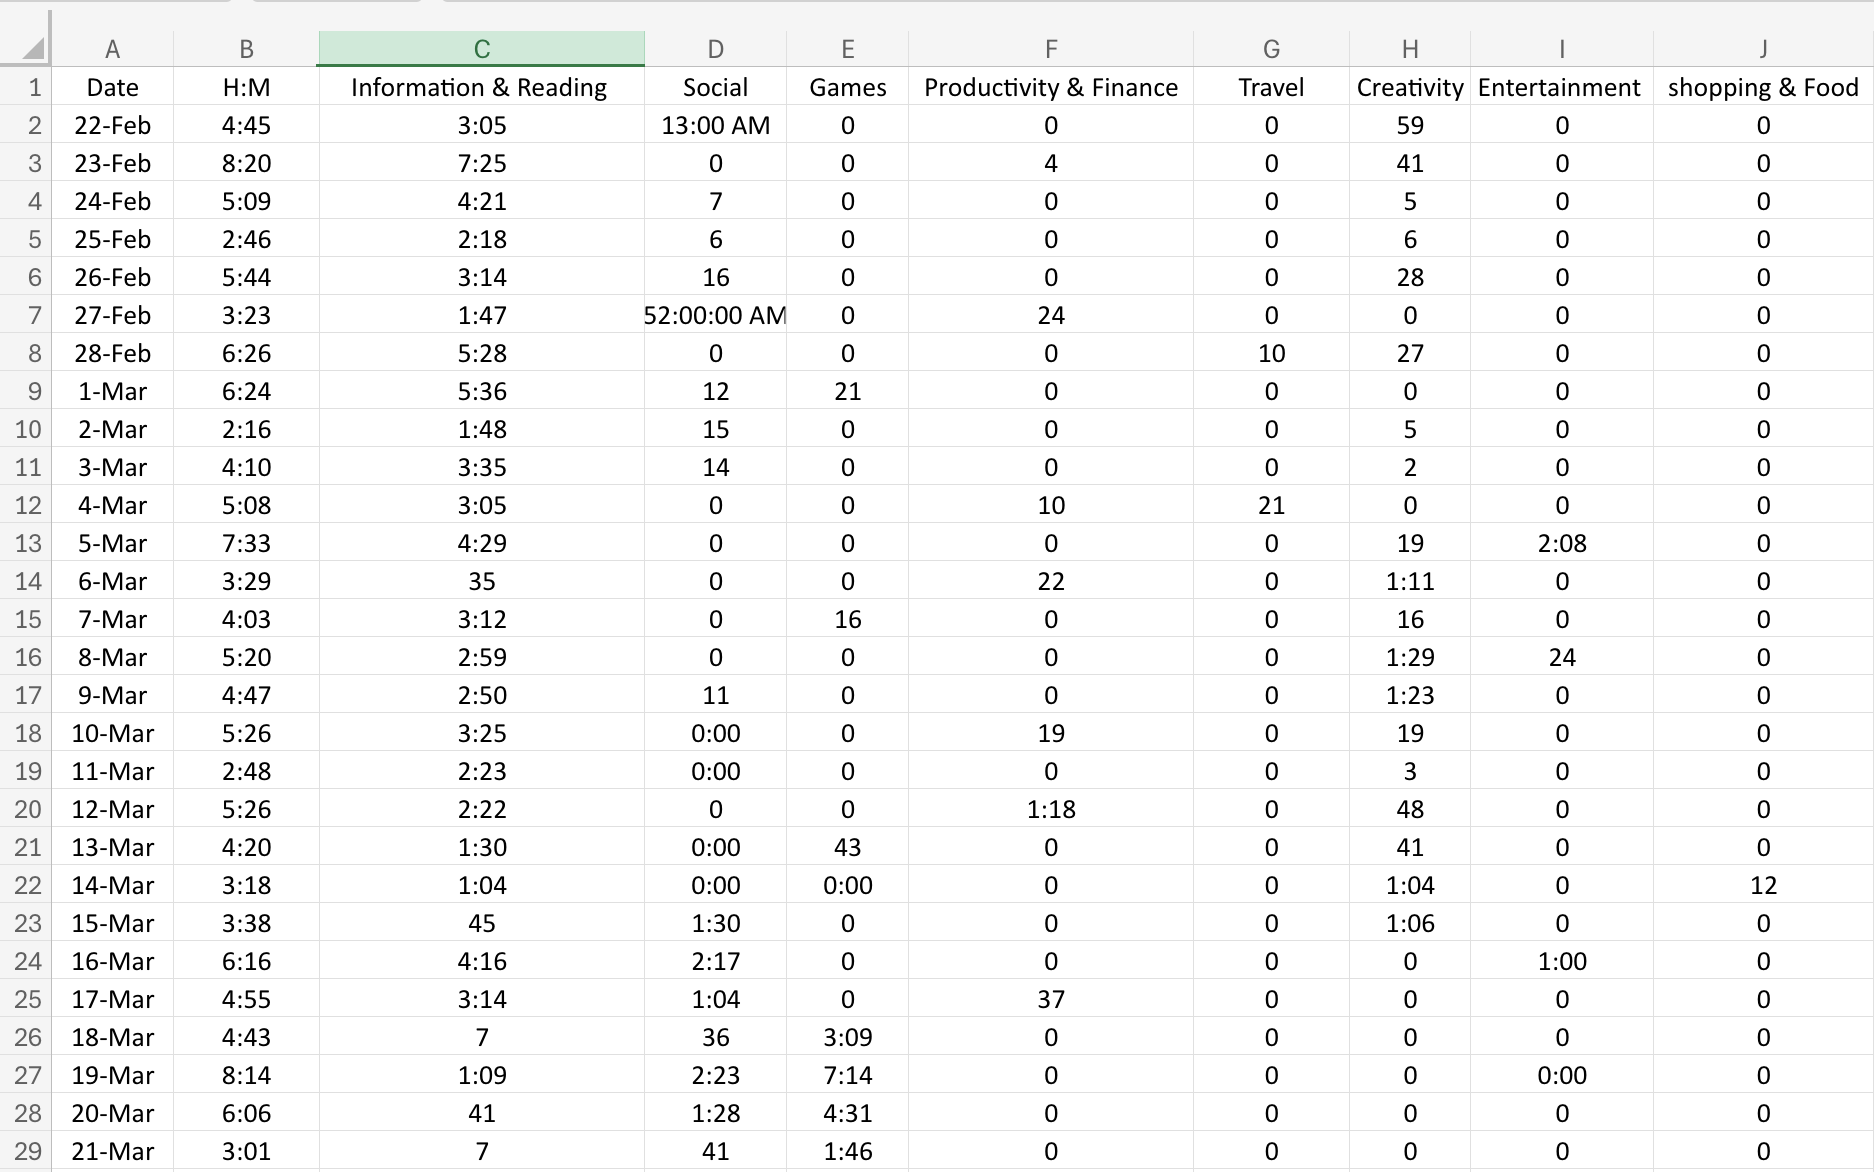
Data represented in excel
Sketches